Complete guide
Energy Monitoring for Commercial and Industrial Buildings: A Complete Guide

Energy is one of the most important operating costs for many commercial and industrial buildings. Yet for many organisations, electricity consumption is still something that is reviewed periodically rather than monitored continuously.
An electricity bill can tell you how much energy was consumed.
It cannot tell you when consumption changed, what caused the change, or whether the change was expected.
- A machine may run longer than usual.
- A ventilation system may continue operating after production has stopped.
- An unusual load may appear during the night.
- A recurring consumption peak may occur when no production activity is taking place.
Individually, these changes may look insignificant. But when the same pattern repeats day after day, the cost can add up.
This is why energy monitoring is about more than simply knowing how many kilowatt hours a building has consumed.
It is about creating visibility into how electricity is being used, identifying changes in consumption and turning energy data into information that supports better decisions.
How Often Do You Really Look at Your Electricity Consumption?
For many organisations, electricity consumption is reviewed when an electricity bill arrives or when periodic reporting is prepared. In practice, this can mean looking at consumption only a handful of times a year.
But electricity consumption does not happen a handful of times a year.
It changes every day, every hour and throughout the operation of a building or industrial facility.
Think about your car.
You would not check the fuel level four or twelve times a year and assume everything will be fine. You check it regularly because the situation changes continuously. You want to know how much fuel you have, whether consumption seems normal and whether something needs attention before the car stops.
Electricity works in much the same way.
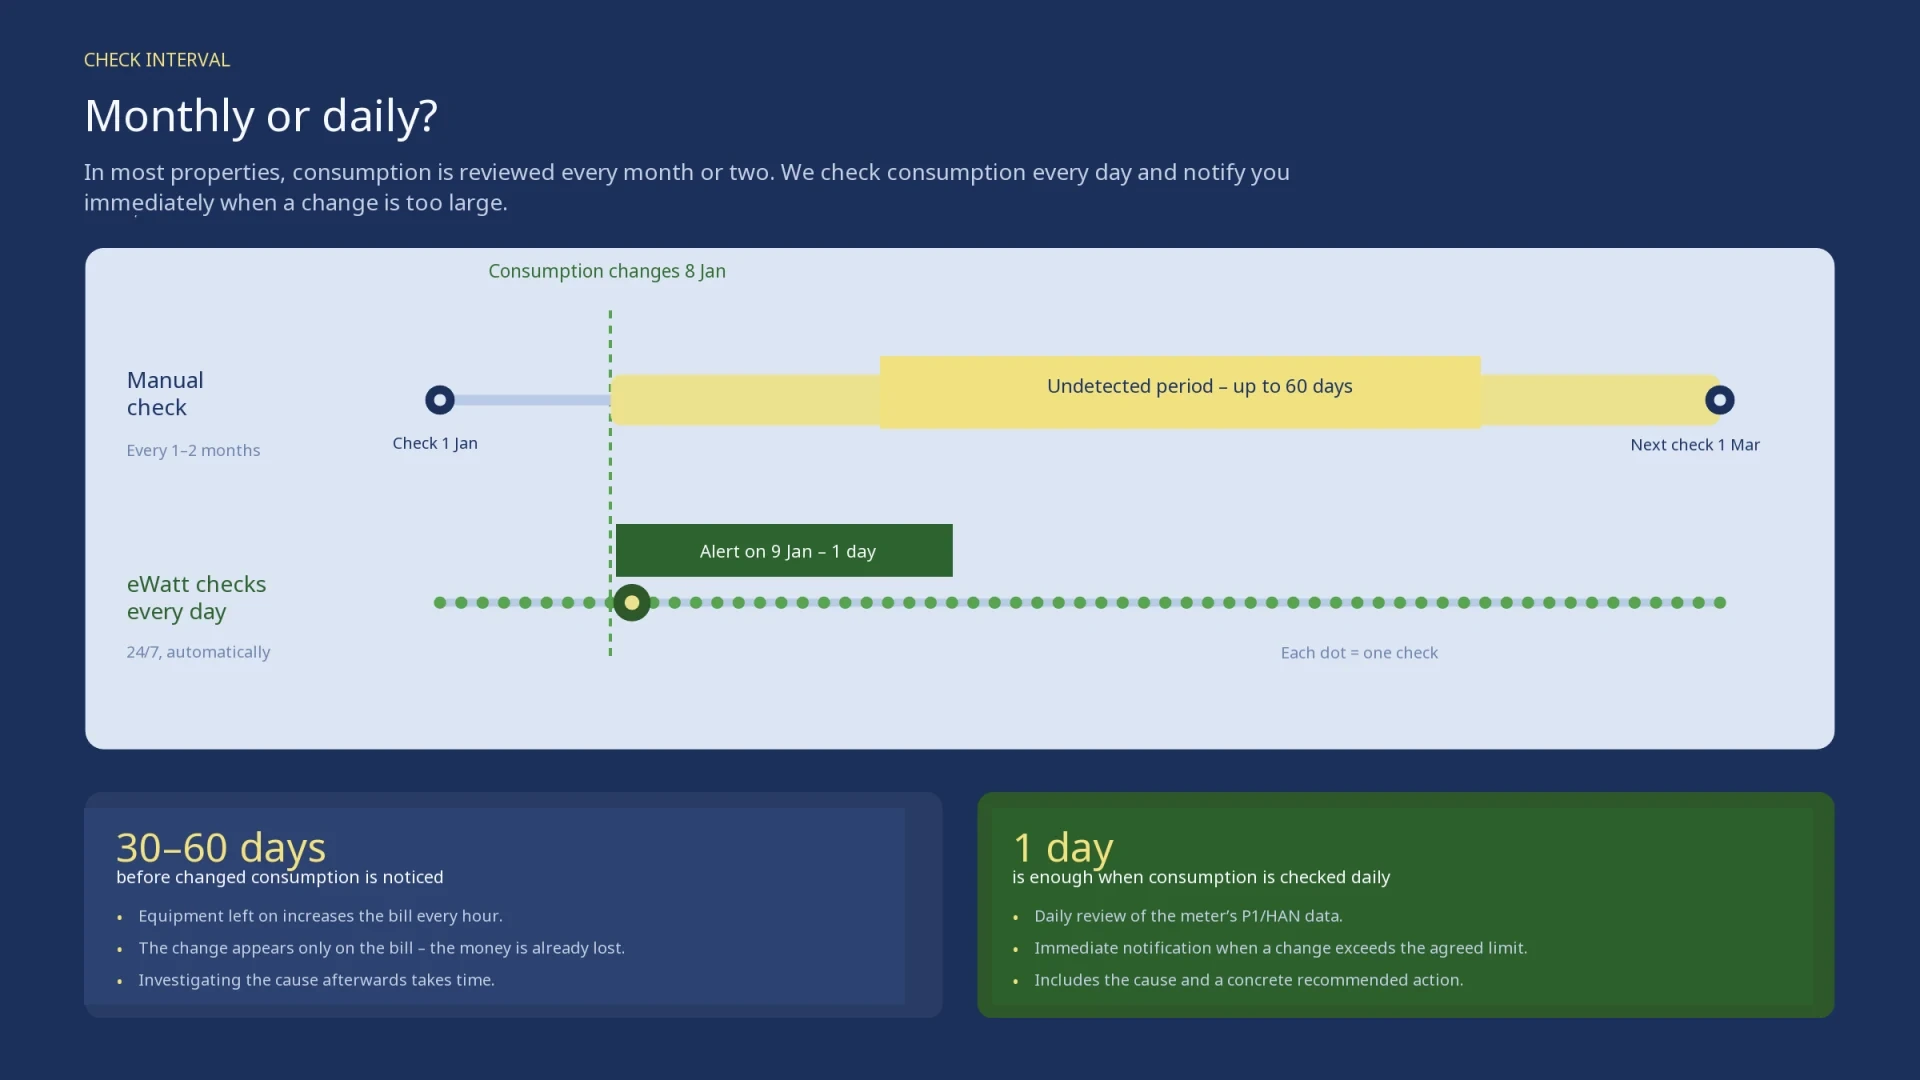
If a facility consumes electricity continuously, checking consumption only occasionally can mean discovering a problem long after it started.
A system may have been running outside operating hours for weeks. A recurring peak may have appeared every Monday morning. A piece of equipment may gradually have started consuming more energy than before.
Without continuous visibility, these patterns can easily become part of the background.
From Occasional Checks to Continuous Visibility
This is where eWatt’s approach to energy monitoring comes in.
eWatt provides continuous visibility into electricity consumption, helping organisations follow how energy is being used over time rather than relying only on occasional consumption checks.
The goal is not simply to collect more data.
The goal is to make changes in energy consumption visible while they are still relevant.
If an unusual consumption pattern is discovered months later, the opportunity to prevent that waste has already passed.
When the same change can be identified as it happens, it becomes possible to investigate the cause, take action and verify whether the situation improves.
This shift from occasional checks to continuous monitoring is the foundation for more effective energy management.
What Is Energy Monitoring?
Energy monitoring is the process of collecting and visualising information about electricity consumption and power use over time.
At its simplest, energy monitoring answers:
How much electricity are we using?
But effective energy monitoring should help answer much more:
- When does consumption increase?
- What does normal consumption look like?
- How does consumption vary between operating periods?
- Are there unexpected peaks?
- Is electricity being used outside normal operating hours?
- Has the consumption pattern changed?
- Which parts of a facility contribute most to consumption?
- Is an efficiency improvement actually reducing energy use?
This is where detailed electricity data becomes valuable.
A single consumption figure provides a snapshot.
A continuous stream of data provides a pattern.
And patterns make it possible to understand how a building or industrial facility actually operates.
- 01
Electricity data
Continuous measurements of consumption and power use.
- 02
Patterns
Baseload, operating hours, recurring peaks and deviations.
- 03
Insights
What changed, when it started and where to investigate.
For a deeper look at how monitoring fits into the wider energy management process, see our guide on Energy Monitoring vs Energy Management: What's the Difference?.
Why Energy Data Matters
Energy data gives organisations something an electricity bill cannot: context.
Consider two facilities that both consume 1,000 MWh of electricity per year.
From an annual consumption figure, they look identical.
But imagine that in the first facility, electricity consumption closely follows production and operating hours.
In the second, significant consumption continues overnight and during weekends, with recurring peaks that cannot be explained by production.
The annual figure is the same.
The operational picture is completely different.
This is why energy data is not only about knowing how much electricity is consumed.
It is about understanding when, where and how electricity is being used.
That visibility can also reveal energy waste that would otherwise remain unnoticed.
For practical examples of what these patterns can look like, see How to Identify Hidden Energy Waste in Commercial Buildings.
And when the data reveals recurring peaks, it can help organisations investigate another important source of energy costs: Peak Demand Charges Explained: The Hidden Cost on Your Electricity Bill.
Energy Monitoring vs Energy Management
Energy monitoring and energy management are closely connected, but they are not the same thing.
Energy monitoring is about visibility.
It helps you see how electricity is being consumed, how consumption changes over time and whether something looks different from what you would normally expect.
Energy management is about using that information to make better decisions.
For example, monitoring may show that electricity consumption remains high after production has ended. Energy management asks the next questions:
- Why is this happening?
- Is it expected?
- What is causing it?
- What can be changed?
- Did the change actually reduce consumption?
This distinction is important because collecting energy data alone does not reduce energy consumption.
The value comes from being able to understand the data and act on it.
For a more detailed explanation of the difference between these two concepts, see Energy Monitoring vs Energy Management: What's the Difference?.
From Energy Monitoring to Energy Analytics
Once energy consumption is being monitored continuously, the next step is understanding what the data is telling you.
This is where energy analytics comes in.
Instead of looking at individual consumption values, analytics helps identify patterns, trends and deviations in the data.
For example, a facility may have a relatively stable consumption pattern during working hours. Over time, however, the data may reveal that:
- consumption starts increasing earlier than usual
- equipment continues running after operating hours
- night-time baseload is higher than expected
- the same peak appears repeatedly
- consumption changes without a corresponding change in production or occupancy
These patterns are difficult to identify from occasional meter readings or monthly electricity bills.
Continuous data creates the possibility to compare what is happening now with what normally happens.
This is particularly valuable in commercial and industrial environments where electricity consumption is closely connected to operating schedules, equipment and production processes.
Data becomes useful when it has context
The purpose of energy analytics is not to give organisations another graph to look at.
It is to make energy data easier to interpret.
A graph can show that consumption increased.
Analytics can help you understand whether the increase is unusual, when it started and where to investigate further.
This is the difference between simply having energy data and being able to use that data as an operational tool.
eWatt’s approach is built around this principle: energy monitoring should help organisations move from seeing consumption to understanding it.
From Energy Analytics to Anomaly Detection
One of the most useful applications of energy analytics is identifying anomalies.
An anomaly is a change or pattern in energy consumption that differs from what would normally be expected.
It does not necessarily mean that something is wrong.
It means that something has changed and may deserve attention.
For example:
- A production line normally shuts down at 18:00, but electricity consumption remains elevated until 21:00.
- A building normally has a low night-time baseload, but consumption suddenly increases after midnight.
- A recurring peak appears at the same time every week without an obvious operational reason.
- A machine gradually starts consuming more electricity than it did previously.
These are not necessarily dramatic events.
In fact, the most valuable insights can come from small deviations that repeat over time.
And this is exactly why continuous monitoring matters.
If you only look at consumption a few times a year, you may see the overall result without ever seeing the individual changes that created it.
With continuous data, those changes become visible.
The AI visibility research around eWatt also shows growing relevance of topics such as energy anomaly detection, AI-based anomaly detection for power usage and platforms for anomaly detection in kWh data.
For readers who want to explore the practical side of identifying these issues, see How to Identify Hidden Energy Waste in Commercial Buildings.
From Anomaly Detection to Action
Identifying an unusual energy pattern is only the beginning.
An anomaly tells you that something has changed. The next step is understanding whether the change is expected, what caused it and whether action is needed.
For example, imagine that electricity consumption remains unusually high after a production line has stopped.
The important question is not simply:
“Can we see the increase in consumption?”
The more important questions are:
- Why is consumption still high?
- Which equipment is responsible?
- Is this expected or unnecessary?
- What can be changed?
- Did the change actually reduce consumption?
This is where energy monitoring becomes an operational tool rather than just a reporting system.
See → Understand → Act → Verify
A useful energy monitoring process can be thought of as four steps:
- 1See
Make electricity consumption visible and understand what is happening across the facility.
- 2Understand
Use historical data, consumption patterns and context to identify unusual behaviour and investigate possible causes.
- 3Act
Change an operating schedule, investigate equipment, address unnecessary consumption or review a recurring peak.
- 4Verify
Check the data again to see whether the action had the expected effect.
This final step is important.
Energy optimisation should not be based on assumptions.
If a change is made, the data should help show whether consumption actually changed afterwards.
Small Changes Can Become Significant Energy Waste
Not every energy anomaly is a major failure.
Often, the most interesting opportunities are small deviations that repeat.
- A machine running for an extra hour every day.
- A ventilation system operating during unoccupied periods.
- A higher-than-usual baseload during weekends.
- A recurring peak that appears under the same circumstances.
Individually, these events may seem too small to investigate.
But energy consumption is continuous.
A small deviation that happens every day can become a significant amount of energy over a month or a year.
This is why continuous monitoring matters. It makes it possible to identify changes in consumption patterns that may otherwise disappear into an aggregated monthly or annual figure.
For a closer look at this type of hidden consumption, see How to Identify Hidden Energy Waste in Commercial Buildings.
Energy Monitoring Should Support Decisions, Not Just Reporting
Traditional energy reporting often answers a retrospective question:
How much energy did we use?
That information is important, but it is only the starting point.
A modern energy monitoring and analytics approach should help organisations move towards more useful questions:
- What changed?
- Why did it change?
- Is the change significant?
- What should we investigate?
- What action should we take?
- Did the action work?
This is the difference between looking at energy consumption and using energy data to manage energy consumption.
For organisations managing multiple buildings or facilities, this becomes even more important. Comparing sites, identifying unusual patterns and prioritising where attention is needed can be difficult when information is spread across separate meters, reports or spreadsheets.
A centralised energy monitoring and analytics platform can bring this information together and make it easier to identify where action may have the greatest impact.
This is particularly relevant when managing commercial and industrial portfolios across multiple locations. eWatt’s existing content on selecting an energy analytics solution explores some of these considerations in more detail: How to Choose the Right Energy Analytics Solution for Commercial and Industrial Buildings.
The Role of eWatt
eWatt focuses on making electricity consumption more visible and understandable for organisations that need to manage energy across commercial and industrial environments.
The underlying principle is simple:
You cannot effectively manage what you cannot see.
But visibility alone is not enough.
The value of energy data comes from being able to identify patterns, recognise deviations and use that information to support decisions.
This means moving from:
- Consumption data
- Energy insights
- Action
The objective is not to create more reports for people to read.
It is to help organisations understand what is happening with their electricity consumption and identify where attention may be needed.
Why Measurement Frequency Matters
Not all energy data gives you the same level of visibility.
Knowing how much electricity a building consumed over a month can be useful for billing and reporting. But it gives you very little information about what happened during that month.
To understand how a building actually operates, you need to see how consumption changes over time.
Imagine that a facility’s electricity consumption is higher than expected for one month.
A monthly figure may tell you that consumption increased.
It does not necessarily tell you:
- when the increase started
- how long it lasted
- whether it happened during working hours
- whether consumption remained high at night
- whether the same pattern occurred repeatedly
- what operational event coincided with the increase
The more frequently electricity consumption is measured, the more detail you have about the behaviour behind the total.
From a Number to a Pattern
Consider two ways of looking at the same facility.
The first approach is to review electricity consumption only occasionally, for example when an electricity bill or periodic report becomes available.
The second is to monitor consumption continuously throughout the year.
In the first case, you may know the result.
In the second, you can see the behaviour that created the result.
This distinction is particularly important for commercial and industrial buildings, where consumption can change significantly depending on production, occupancy, equipment, HVAC operation and operating schedules.
A recurring night-time load, for example, may disappear into a monthly total.
A continuous monitoring system can show that the load appears every night.
A machine that runs for one unnecessary hour may barely change the monthly consumption figure.
When the same hour is repeated every working day, the pattern becomes much more meaningful.
For a closer look at how unexpected consumption patterns can reveal hidden savings opportunities, see How to Identify Hidden Energy Waste in Commercial Buildings.
Why Continuous Monitoring Changes the Picture
eWatt’s approach is based on making electricity consumption visible continuously rather than treating it as something to check only a few times a year.
The difference is not simply about having more numbers.
It is about having enough data to recognise patterns, deviations and changes in behaviour.
Think about your car again.
You do not check the fuel level a few times a year.
You check it regularly because fuel is being consumed continuously. You want to know what is happening before the tank is empty, not after the car has stopped.
Electricity consumption deserves the same kind of attention.
A building does not consume electricity only when someone happens to open an electricity bill.
It consumes electricity continuously.
So the more continuously you monitor it, the better you can understand what is actually happening.
The purpose is not to watch a graph 24/7.
The purpose is to have the data available when something changes.
That way, you can investigate the change, decide whether action is needed and later verify the result.
High-Resolution Data Helps Reveal What Aggregated Data Hides
The difference becomes even clearer when looking at short-lived events.
- A consumption peak may last only a short period.
- An unexpected load may appear outside normal operating hours.
- A piece of equipment may switch on and off repeatedly.
- A process may consume more energy than usual for only part of the day.
When these events are aggregated into longer reporting periods, the detail can disappear.
With more granular data, the same consumption can be viewed as a sequence of events and patterns.
Aggregated data
Monthly or periodic totals
“We used more electricity this month.”
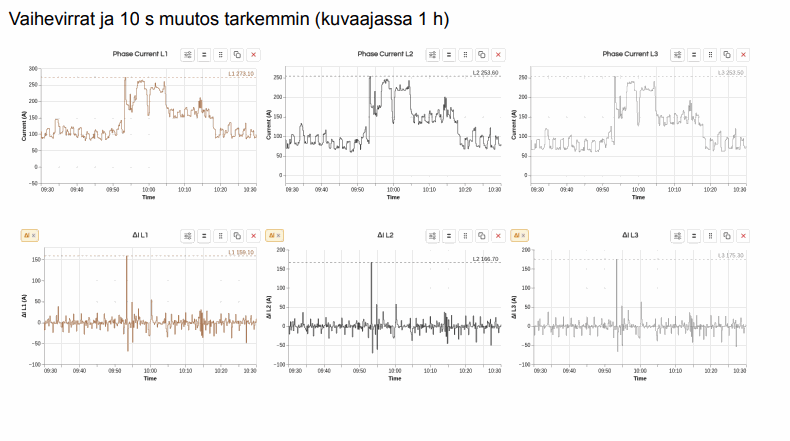
High-frequency data
10-second measurements
“Something changed in our electricity consumption, and we can see when it happened.”
This allows energy teams to move from:
“We used more electricity this month.”
to:
“Something changed in our electricity consumption, and we can see when it happened.”
That is a much more useful starting point for investigation and optimisation.
If you are evaluating an energy monitoring or analytics platform, measurement frequency and data resolution should be among the factors you consider. See How to Choose the Right Energy Analytics Solution for Commercial and Industrial Buildings for more guidance.
Why 10-Second Measurements Matter
The value of energy monitoring does not only depend on whether data is available. It also depends on how frequently consumption is measured.
With more frequent measurements, short-lived changes in electricity consumption become easier to see.
This is particularly important in commercial and industrial environments, where equipment can start and stop, production processes can change and power demand can fluctuate within minutes.
From occasional data to detailed visibility
Imagine a machine that creates a short but significant increase in power demand.
If you only look at aggregated consumption data, that event may be difficult to identify.
With more frequent measurements, the same event becomes part of a visible pattern.
This is where eWatt’s measurement approach becomes particularly valuable.
eWatt measures electricity consumption at 10-second intervals, providing a much more detailed view of how electricity use changes throughout the day.
Instead of seeing only the total result, you can see the changes that happen along the way.
That can help reveal:
- short-term power peaks
- unexpected changes in equipment behaviour
- unusual operating patterns
- changes outside normal operating hours
- recurring events that may otherwise be difficult to identify
The purpose of 10-second measurements is not to give energy teams more data to look at manually.
It is to create a sufficiently detailed picture of electricity consumption so that meaningful changes do not disappear inside aggregated figures.
Why does this matter?
Because energy consumption is dynamic.
A facility can move from normal operation to unusually high power demand in seconds or minutes.
If the data only captures broad intervals, some of these changes may be averaged out.
With more detailed measurements, the underlying behaviour becomes easier to investigate.
This creates a stronger foundation for energy analytics, anomaly detection and informed decision-making.
Energy Monitoring for Commercial vs Industrial Buildings
The need for energy monitoring exists in both commercial and industrial buildings, but the way electricity is consumed can be very different.
In a commercial building, energy consumption may be strongly influenced by occupancy, heating and cooling, ventilation, lighting and operating hours.
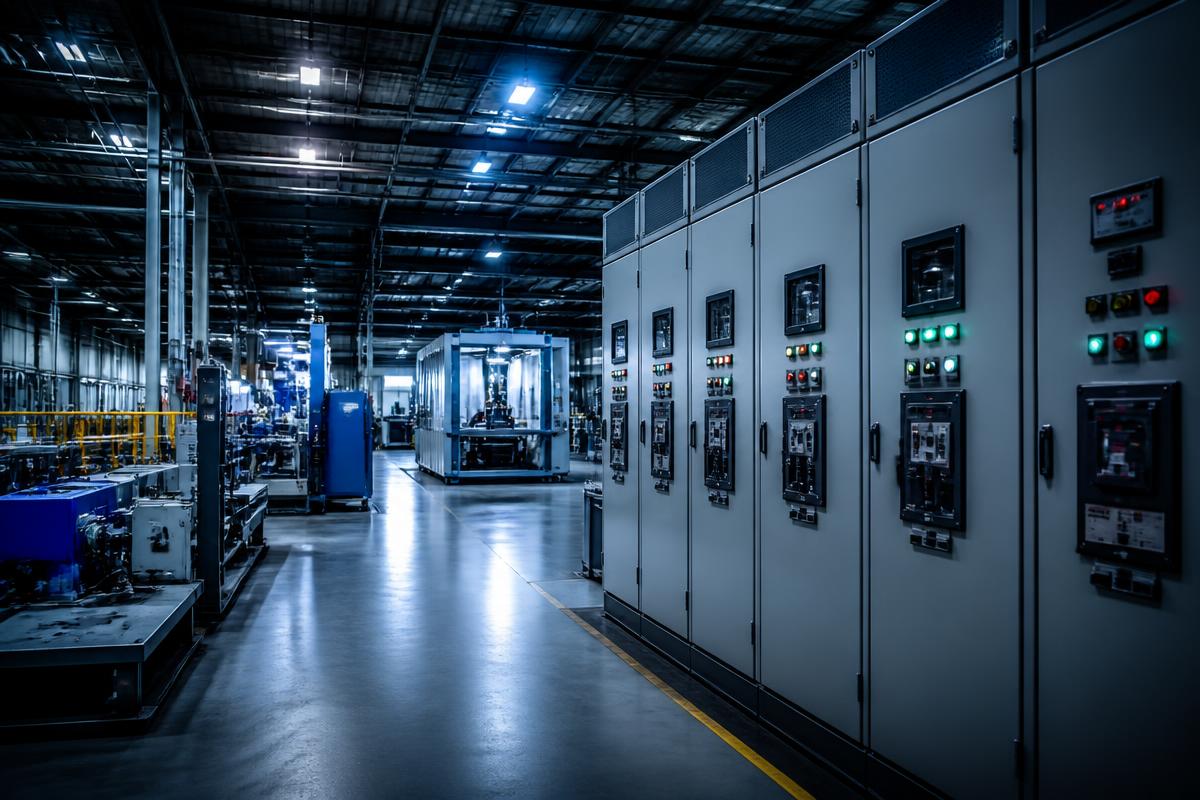
In an industrial facility, electricity consumption can be closely connected to production processes, machinery, shifts and operating schedules.
This means that there is no single energy consumption pattern that applies to every facility.

Commercial buildings
Occupancy, heating and cooling, ventilation, lighting and operating hours shape the consumption profile.
Industrial facilities
Machinery, production processes, shifts and operating schedules create step changes and high power peaks.
Commercial buildings
For commercial buildings, energy monitoring can help organisations understand patterns such as:
- energy use during occupied and unoccupied hours
- HVAC-related consumption
- unnecessary night-time or weekend consumption
- recurring peaks
- changes in consumption following changes in occupancy or operating schedules
The objective is to understand whether energy use follows the way the building is actually being operated.
Industrial facilities
Industrial environments can be more complex.
Different machines and production processes can have very different energy profiles. Changes in production schedules can also have a direct effect on electricity consumption.
Energy monitoring can help make these relationships more visible.
For example, if electricity consumption increases significantly while production output remains unchanged, the data may provide a starting point for further investigation.
Similarly, if a production process regularly creates a high power peak, understanding when and why that peak occurs can help organisations investigate potential optimisation opportunities.
Managing Energy Across Multiple Sites
The challenge becomes even greater when an organisation operates several buildings or facilities.
Instead of one electricity consumption profile, there may be dozens or hundreds.
Each location may have different:
- operating hours
- equipment
- production processes
- energy consumption patterns
- baseline consumption
- local conditions
Without a centralised view, comparing these sites can be difficult.
A multi-site energy monitoring approach makes it possible to bring consumption data together and identify differences between locations.
For example:
- Which site has the highest energy intensity?
- Which facilities have unusually high baseload?
- Where are recurring peaks occurring?
- Which sites have changed their consumption patterns?
- Where should the energy team investigate first?
This turns energy monitoring from a tool for looking at individual buildings into a way of managing an entire portfolio.
For organisations evaluating solutions for multiple commercial or industrial locations, see How to Choose the Right Energy Analytics Solution for Commercial and Industrial Buildings.
What Should You Look for in an Energy Monitoring Solution?
Choosing an energy monitoring system is not simply about finding a platform that displays electricity consumption.
The important question is:
Can the system provide the information you need to understand and act on your energy consumption?
Depending on the organisation’s needs, important factors may include:
Measurement frequency
How frequently is electricity consumption measured? More detailed data can provide greater visibility into short-term changes, peaks and operating patterns.
Historical data
Can you compare current consumption with previous periods and identify changes over time?
Analytics
Does the system help you move beyond raw consumption data and identify meaningful patterns?
Anomaly detection
Can unusual consumption patterns be identified and investigated?
Multi-site visibility
Can you monitor multiple buildings or facilities from one place?
Reporting
Can the data be used to create reports that support energy management and decision-making?
Actionability
Most importantly: does the system help you understand what to do with the information?
A good energy monitoring solution should not simply produce more data.
It should make the data useful.
For a more detailed framework for evaluating energy analytics platforms, see How to Choose the Right Energy Analytics Solution for Commercial and Industrial Buildings.
How eWatt Helps Turn Energy Data Into Action
This is where the different elements of energy monitoring come together.
eWatt provides organisations with continuous visibility into electricity consumption, helping them understand how energy is being used across commercial and industrial environments.
The process can be thought of as:
- 01Measure
Collect detailed electricity consumption data.
- 02Monitor
See how consumption changes over time.
- 03Analyse
Identify patterns, trends and deviations.
- 04Detect
Find unusual consumption that may require attention.
- 05Act
Investigate the cause and decide what action to take.
- 06Verify
Use the data to see whether the action had the intended effect.
The purpose is not to make energy management more complicated.
It is to make electricity consumption easier to understand and easier to act on.
Because the most useful energy data is not necessarily the data you can collect.
It is the data that helps answer:
- What is happening?
- Why is it happening?
- What should we do next?
The Bottom Line
Energy monitoring is the foundation for understanding how electricity is used.
But monitoring alone is not the end goal.
The real value comes from connecting measurement, analytics, anomaly detection and action.
A monthly or occasional view can tell you what happened.
Continuous monitoring can help you understand how it happened.
And when energy data is detailed enough to reveal patterns and changes, organisations have a stronger basis for identifying waste, investigating problems and improving operations.
For commercial and industrial organisations, the question is therefore not simply:
“How much electricity did we use?”
It is:
“What is our electricity consumption telling us, and what can we do about it?”
That is where energy monitoring becomes energy management.
And that is where data becomes a tool for better decisions.
Frequently Asked Questions About Energy Monitoring
What is energy monitoring?
Energy monitoring is the continuous measurement and analysis of electricity consumption to understand how energy is being used over time. It helps organisations identify consumption patterns, changes and potential areas for optimisation.
Why is continuous energy monitoring important?
Electricity consumption changes continuously. Monitoring it only occasionally can hide short-term peaks, unusual consumption and changes in operating patterns. Continuous monitoring provides a more detailed view of what is happening and makes it easier to investigate changes while they are still relevant.
What is the difference between energy monitoring and energy management?
Energy monitoring provides visibility into energy consumption. Energy management uses that information to make decisions, take action and improve how energy is used. For a more detailed explanation, see Energy Monitoring vs Energy Management: What's the Difference?.
What is energy analytics?
Energy analytics is the process of using energy data to identify patterns, trends and deviations that may not be obvious from raw consumption figures.
What is energy anomaly detection?
Energy anomaly detection identifies consumption patterns that differ from what would normally be expected. An anomaly does not necessarily mean something is wrong. It indicates that a change has occurred and may need investigation.
How often should electricity consumption be measured?
It depends on the purpose and the level of detail required. Occasional readings can provide an overview of total consumption, while more frequent measurements provide greater visibility into short-term changes, peaks and operating patterns. For facilities where understanding changes in electricity use is important, more granular data can provide a stronger basis for analysis and action.
Can energy monitoring help identify hidden energy waste?
Yes. Continuous monitoring can reveal patterns such as unnecessary consumption outside operating hours, recurring peaks or changes in equipment behaviour. These patterns can then be investigated to determine whether they represent an opportunity to reduce energy use. See How to Identify Hidden Energy Waste in Commercial Buildings.
Is energy monitoring useful for multiple buildings?
Yes. For organisations operating multiple facilities, centralised energy monitoring can make it easier to compare sites, identify unusual consumption patterns and prioritise where further investigation may be needed.
Ready to Get More From Your Energy Data?
Understanding electricity consumption starts with good data.
But the real value comes from being able to see changes, understand what is happening and take action based on that information.
eWatt helps commercial and industrial organisations turn continuous electricity data into actionable energy insights.