Asiakastarina · Teollisuus
eWatt
Sähködata paljasti verkkoyhtiön vian
Kun keskisuomalaisen teollisuusyrityksen laitteet alkoivat hajota selittämättä, vastaus ei löytynyt omasta tuotannosta. Se löytyi sähköverkosta, ja eWattin data todisti sen sekuntien tarkkuudella.
- Toimiala
- Valmistava teollisuus
- Sijainti
- Keski-Suomi
- Ajanjakso
- Tammikuu 2026
- Tulos
- Dokumentoitu reklamaatio verkkoyhtiölle
Lyhyesti
- Tuotantolaitteet hajosivat toistuvasti ilman selvää syytä tammikuussa 2026
- eWattin 10 sekunnin sähködata tallensi täsmälliset virtapiikit kolmesta eri tapahtumasta
- Data osoitti kiistattomasti, että häiriö tuli sähköverkosta, ei asiakkaan omista laitteista
- Dataraportti toimitettiin verkkoyhtiölle reklamaation liitteeksi
Tilanne
Tammikuussa 2026 keskisuomalaisen valmistavan teollisuuden tuotantolaitoksella alkoi esiintyä selittämättömiä vikatilanteita. Herkkä tuotantoautomaatio kaatui toistuvasti, paineilmakompressori rikkoutui ja nosturi vioittui. Huoltohenkilöstö joutui reagoimaan kiireellisesti useita kertoja kuukauden aikana.
Syytä etsittiin ensin omasta järjestelmästä. Laitteet käytiin läpi, prosesseja tarkasteltiin, automaatiota tutkittiin. Mitään selvää vikaa ei löytynyt. Samaan aikaan tuotanto seisoi ja korjauskulut kasvoivat.
Onneksi kohteessa oli jo ennestään asennettu eWattin sähkömonitorointi. Se oli kerännyt dataa hiljaa taustalla joka päivä, kymmenen sekunnin välein, kaiken muun toiminnan ohessa.
Mitä sähködata kertoi
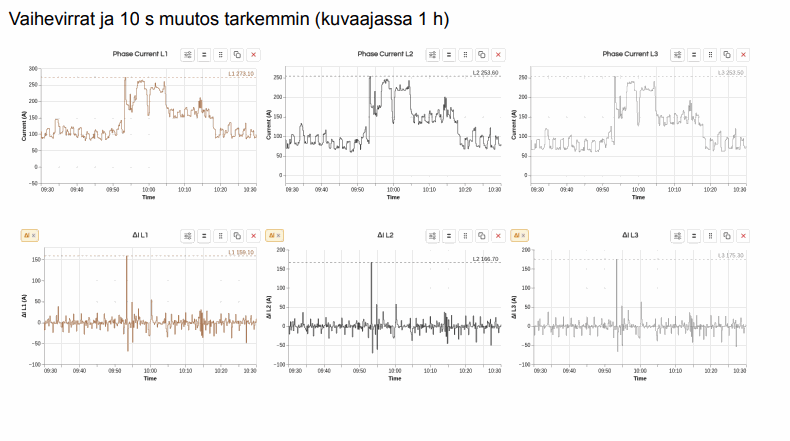
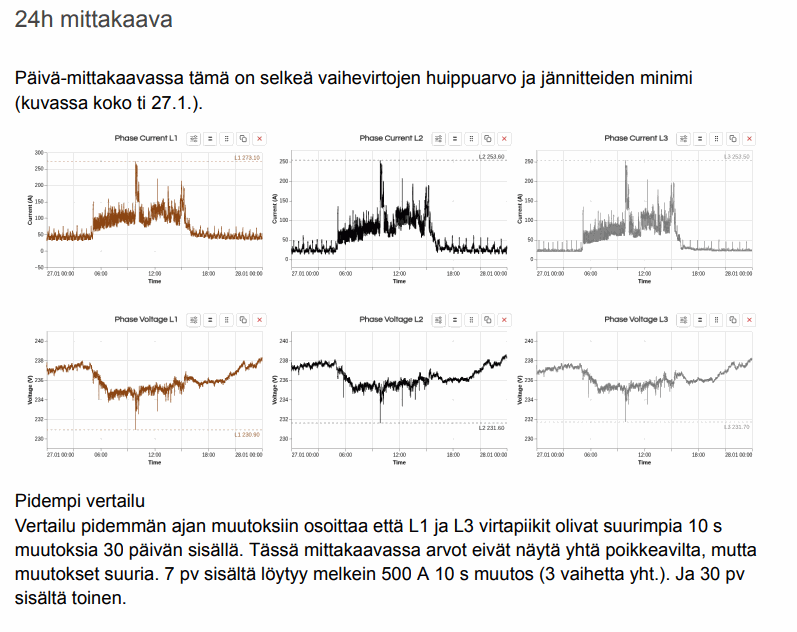
Kun laiterikko tapahtui 27. tammikuuta kello 9:53, eWattin järjestelmä tallensi täsmälleen mitä tapahtui. Kymmenessä sekunnissa sähkövirta nousi räjähdysmäisesti kaikissa kolmessa sähkönsyöttöjohtimessa samanaikaisesti, ja samalla hetkellä jännite laski kaikissa vaiheissa.
500 A
Virtapiikki yhteensä kaikissa kolmessa vaiheessa 10 sekunnissa
3,5 V
Samanaikainen jännitteen lasku jokaisessa vaiheessa
3 kertaa
Sama ilmiö toistui 30 päivän sisällä
Mutta kyse ei ollut vain yhdestä tapahtumasta. Historiadatasta löytyi täsmälleen sama kaava myös 7. tammikuuta ja 22. tammikuuta. Kolme erillistä iskua saman kuukauden sisällä, kaikki samanlaisia.
Tapahtumakalenteri
7.1.2026klo 07:31
Ensimmäinen poikkeama
Äkillinen virtapiikki kaikissa kolmessa vaiheessa samanaikaisesti. Teho kasvoi hetkellisesti 61 kW ja jännite laski 2,5 volttia jokaisessa vaiheessa. Tapahtuma tallentui dataan täsmällisin kellonajoin.
22.1.2026klo 12:32
Toistuva ilmiö
Samanlainen virtapiikki toistui. L1-vaiheen virta kasvoi 156 A, L2 161 A ja L3 169 A kymmenen sekunnin aikana. Reaktiivinen teho kasvoi yli 112 kVAr. Piikki näkyi selkeästi myös päivittäisessä kuvaajassa.
27.1.2026klo 09:53
Laiterikko ja ratkaiseva todiste
Kolmas ja voimakkain piikki. Virtamuutokset olivat suurimpia koko 30 päivän mittaushistoriassa. Paineilmakompressori ja nosturi vioittuivat. eWattin data tallensi tapahtuman sekuntien tarkkuudella.
Mitä tämä tarkoittaa käytännössä
Kuvittele vesijohto, josta tulee normaalisti sopiva paine. Sitten jostain syystä paine pyrähtää hetkeksi moninkertaiseksi ja iskee laitteistoon. Tällainen isku voi rikkoa herkkiä laitteita, vaikka se kestäisi vain sekunnin. Juuri näin kävi, mutta vesijohdon sijaan kyse oli sähköverkosta.
Miksi tämä ei voinut olla asiakkaan oma vika
Tässä on se ratkaiseva yksityiskohta: virtapiikki tapahtui kaikissa kolmessa sähköjohtimessa täsmälleen samaan aikaan. Kun jokin asiakkaan oma laite käynnistyy tai sammuu, se näkyy tyypillisesti yhdessä tai kahdessa johtimessa, ei kaikissa kolmessa näin voimakkaana ja symmetrisesti.
Lisäksi tuotantolaitoksessa ei yksinkertaisesti ollut riittävästi laitteita, joista tämän kokoinen piikki olisi voinut syntyä. Olemassa oleva laitekanta ei olisi kyennyt tuottamaan näin suurta ja nopeaa muutosta. Tämä sulkee pois sisäisen vian mahdollisuuden kokonaan.
Piikki tuli verkosta päin. Se oli sähköverkkoyhtiön syöttöhäiriö, joka iski tuotantolaitokseen ja vaurioitti herkimpiä laitteita.
Ilman seurantaa tilanne olisi näyttänyt tältä: laitteet rikkoontuvat selittämättä, korjataan, ja toivotaan ettei tapahdu uudestaan. Seurannan kanssa: tiedetään tarkasti mitä tapahtui, milloin, mistä syystä, ja kenelle lasku kuuluu.
Lopputulos
eWattin mittausdata koottiin dokumentoiduksi raportiksi, joka toimitettiin verkkoyhtiölle reklamaation liitteeksi. Datassa oli täsmälliset kellonajat, virta-arvot ja jännitteen muutokset jokaisesta vaiheesta kolmesta erillisestä tapahtumasta. Ei arvausta. Ei epäilyä. Kiistaton todiste.
Asiakas sai vahvan lähtöaseman neuvotteluihin verkkoyhtiön kanssa sekä arvokasta tietoa kiinteistönsä sähkönlaadun tilasta. Jatkossa eWattin reaaliaikainen hälytys ilmoittaa välittömästi, jos sähkönlaatu heikkenee kriittiselle tasolle, jolloin juurisyy saadaan selvitettyä ennen kuin laitteet ehtivät vaurioitua.
Ilman seurantaa
- Laitteet rikkoontuvat ilman selvää syytä
- Korjataan ja odotetaan seuraavaa vikaa
- Ei todisteita verkkoyhtiölle
- Ei tietoa milloin seuraava häiriö tulee
eWattin kanssa
- Täsmälliset mittaukset tallentuivat automaattisesti
- Vian alkuperä todistettiin kiistattomasti
- Dataraportti reklamaation liitteeksi
- Reaaliaikaiset hälytykset tuleviin häiriöihin